When I first started playing with the distribution functions in R I would always get confused as to what the different name combinations meant. For example, the differences between rnorm(), dnorm(), dt(), rbinom() were all pretty mysterious to me. Now I understand these names are composed of two parts:

Synopsis: Below are a number of examples comparing different ways to use base R, the tidyverse, and data.table. These examples are meant to provide something of a Rosetta Stone (an incomplete comparison of the dialects, but good enough to start the deciphering process) for comparing some common tasks in R using the different dialects. The examples start fairly simply and get progressively harder. I provide some additional information along the way, in case folks are new to R or programming more…

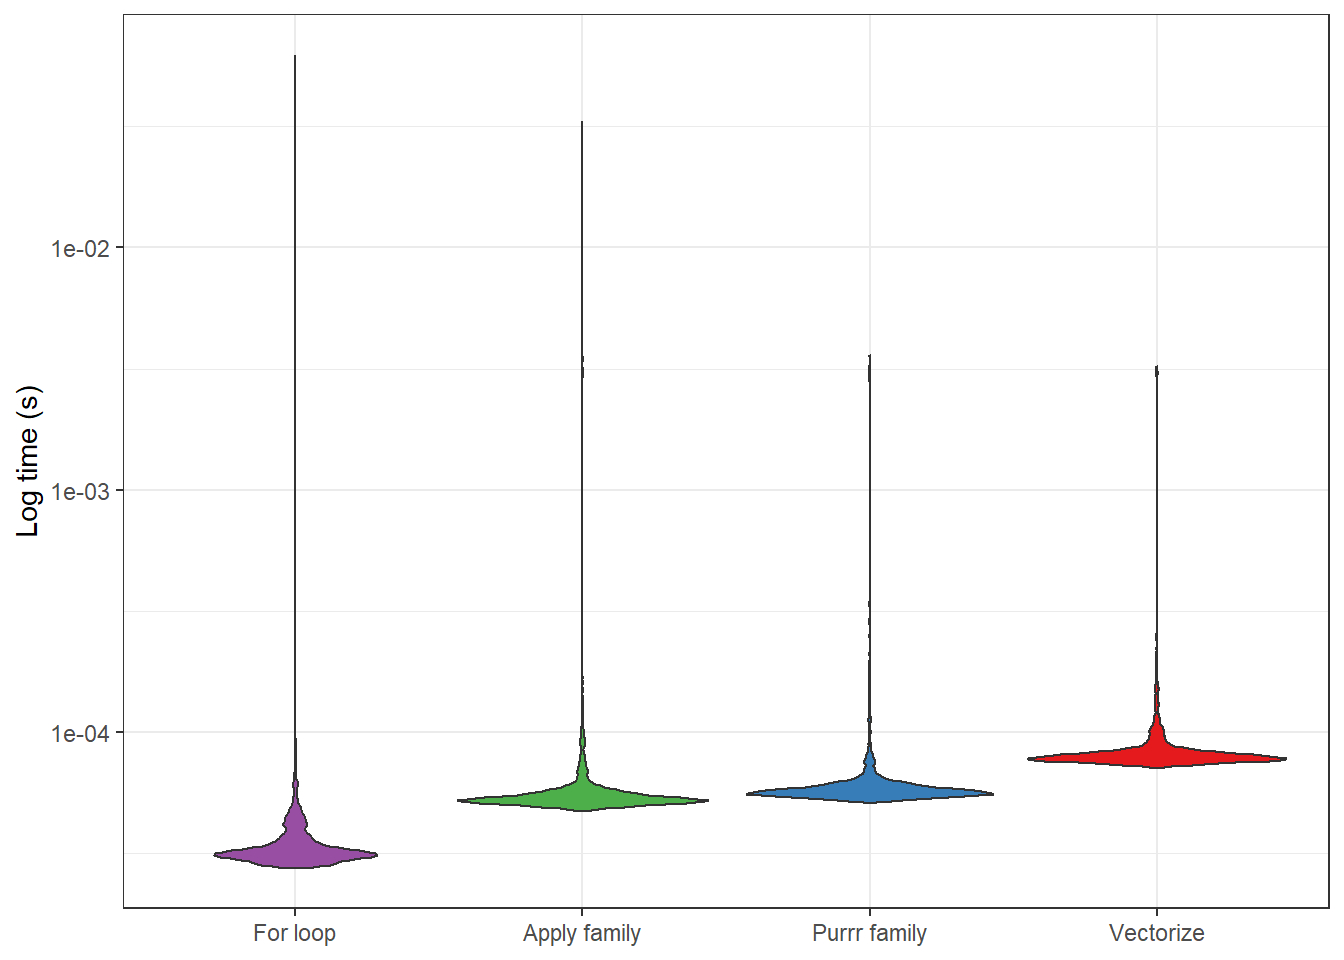
One of the cool things about R is that it is a vectorized language. This means that you can apply a vector (i.e., a series of values) to functions like sqrt and log without the need to write a for loop. While I was naive to how useful this was when learning R, in retrospect, I now very much appreciate this behavior.


