Vectorize in R
Letting the Vectorize function do the heavy-lifting when it comes to applying complicated control flows.
Vectorization in R
One of the cool things about R is that it is a vectorized language. This means that you can apply a vector (i.e., a series of values) to functions like sqrt and log without the need to write a for loop. While I was naive to how useful this was when learning R, in retrospect, I now very much appreciate this behavior.
Not every function has an obvious path towards vectorization, however. One such problem path occurs when control flow is involved. That is, when functions like if and else are used to evaluate different condtions. These functions can only handle one value at a time. For example, if you wanted to know if one value equaled another, you can check this condition for one condition (note: this is an illustrative example; there are better ways of checking this condition):
if(1 == 0) {
  "Equal"
} else {
  "Not equal"
}
## [1] "Not equal"However, the moment you apply this logic to a vector with length greater than 1, you no longer get the expected or desired result:
if(c(1, 0) == 0) {
  "Equal"
} else {
  "Not equal"
}
## Warning in if (c(1, 0) == 0) {: the condition has length > 1 and only the first
## element will be used## [1] "Not equal"One way of getting around the problem of more than one value in if-else statements is to use their vectorized equivalent, namely ifelse from base R or if_else from dplyr. However, while these functions are great for relatively simple conditions, they can get cumbersome to read and write when conditions are nested. They also can’t handle else-if conditions. For example, I find the following difficult to read and simulaneously limited in scope (but maybe that’s just me):
ifelse(
  test = `condition 1`,
  yes = X,
  no = ifelse(
    test = `condition 2`,
    yes = Y,
    no = ifelse(
      ...
      )
    )
  )
)
So, wouldn’t it be nice if we could somehow combine more complicated control flows with vectorization?
Enter: Vectorize.
The Vectorize function
What Vectorize does is it takes a function and generates a vectorized equivalent to that function, allowing us to apply a much more complicated control logic to a vector without having to do the heavy lifting of having a write a for loop, use the *apply family of functions, or the map functions in purrr. This behavior makes it much easier to apply such functions to functions like mutate in dplyr.
As an aside, Vectorize also represents another neat aspect of R: functional programming. That is, Vectorize takes a function and uses functions to return another function. To me, these “function factories” are kind of mind blowing. For more on function factories, check out Hadley Wickham’s chapter on the topic.
But let’s check out an example of how we could use Vectorize on some problem.
Vectorize in action
As an example, I’m going focus on a common application in isotope hydrology. The theoretical details of this problem are beyond the scope of this post, and I’ve simplified the issue quite a bit, but suffice it to say that the problem involves inputing a temperature, which then returns a value near 1. However, the result is conditional on a number of factors, such as the isotope involved, phase (e.g, liquid, gas), etc. In the example below I’m using a simplified form of this problem to reduce complexity.
First, I need to define two functions for when temperatures are warm or cold:
warm <- function(TK) { #TK: Temperature in Kelvin
  a <- 24.844
  b <- -76.248
  c <- 52.612
  first <- a * ((1e+06) / ((TK^2)))
  second <- b * (1e+03)/(TK)
  exp((first + second + c) / 1000)
}

cold <- function(TK) {
  a <- 24.844
  b <- -76.248
  c <- 71.912
  first <- a * ((1e+06) / ((TK^2)))
  second <- b * (1e+03)/(TK)
  exp((first + second + c) / 1000)
}
Now to define our function containing the control logic.
For loop solution
When I first wrote up this problem I didn’t know about the Vectorize function so I wrote it as a for loop. I think some are more comfortable with that kind of solution, so I’m going to present it for comparison purposes:
equil_frac_loop <- function(Ta, verbose = FALSE){
  frac_factor <- numeric()
  for(i in 1:length(Ta)) {
    if(Ta[i] > 100 & verbose) {
      warning(paste('Temperature values are outside the bounds of the method -',
        'may generate anamolous data.'))
    }
    temp_K <- Ta[i] + 273.15 #Convert C to K
    if(Ta[i] >= 0) {
      frac_factor[i] <-  warm(temp_K)
    } else if(Ta[i] < 0) {
      frac_factor[i] <-  cold(temp_K)
    } else {
      stop("Something's wrong with your temperature values.")
    }
  }
  frac_factor
}
Vectorized solution
To generate the vectorized solution, we first write the unvectorized “skeleton” to our problem:
equil_frac_unvec <- function(Ta, verbose = FALSE){
  if(Ta > 100 & verbose) {
    warning(paste('Temperature values are outside the bounds of the method -',
      'may generate anamolous data.'))
  }
  temp_K <- Ta + 273.15 #Convert C to K
  if(Ta >= 0) {
    return(warm(temp_K))
  } else if(Ta < 0) {
    return(cold(temp_K))
  } else {
    stop("Something's wrong with your temperature values.")
  }
}
Now, here is where the magic happens. To vectorize the above function, all we need to do is wrap it with Vectorize and save it as a new object.
equil_frac_vec <- Vectorize(equil_frac_unvec)And that’s it! Our unvectorized function is now vectorized. But do the for loop and vectorized forms generate the same solution? Let’s check the outputs with the all.equal function, which for a numeric vector, will check that each element in a “target” and “current” vector are the same.
#First let's generate some "temperatures".
temperatures <- runif(n = 20, min = -30, max = 30)
#Apply the two solutions.
vec_out <- equil_frac_vec(Ta = temperatures)
loop_out <- equil_frac_loop(Ta = temperatures)
#Test if they are equivalent; this will return TRUE if all values are the same.
all.equal(loop_out, vec_out)
## [1] TRUEWell, look at that! all.equal returned TRUE, meaning both methods produced the same results.
Speed
Now that we have some different forms of the same control logic, the question becomes: Which is faster? Optimizing such a simple function probably won’t matter much, but in other cases it could be important.
For benchmarking I’m using the bench package, which can be used to generate some really nice insights into function performance.
For the sake of comparison, I’m also going to include a solution that uses the unvectorized form of the function, wrapped with base::sapply and purrr::map_dbl, which should generate the same results as the other two functions. But first let’s load some libraries that will be useful in the comparison.
library(bench)## Warning: package 'bench' was built under R version 3.6.2library(tidyverse)## Warning: package 'tidyverse' was built under R version 3.6.2## Warning: package 'tidyr' was built under R version 3.6.2## Warning: package 'dplyr' was built under R version 3.6.2Benchmarking
This first bit of code just tells bench which functions to run and how many times.
vector_compare <- bench::mark(
  `Apply family` = sapply(temperatures, equil_frac_unvec),
  `Purrr family` = map_dbl(temperatures, equil_frac_unvec),
  `Vectorize` = equil_frac_vec(temperatures),
  `For loop` = equil_frac_loop(temperatures),
  iterations = 10000
)
Eazy peazy! So, what do the results look like (after removing some things that we don’t care as much about for the purposes of this post)?
vector_compare %>%
  select(expression, min, median, `itr/sec`, mem_alloc, total_time) %>%
  arrange(median) %>%
  mutate(expression = names(expression))
## # A tibble: 4 x 5
## expression min median `itr/sec` mem_alloc
## <chr> <bch:tm> <bch:tm> <dbl> <bch:byt>
## 1 For loop 27.6us 32.1us 28704. 792B
## 2 Apply family 47.4us 53.3us 17074. 720B
## 3 Purrr family 50.9us 57.3us 16686. 4.23KB
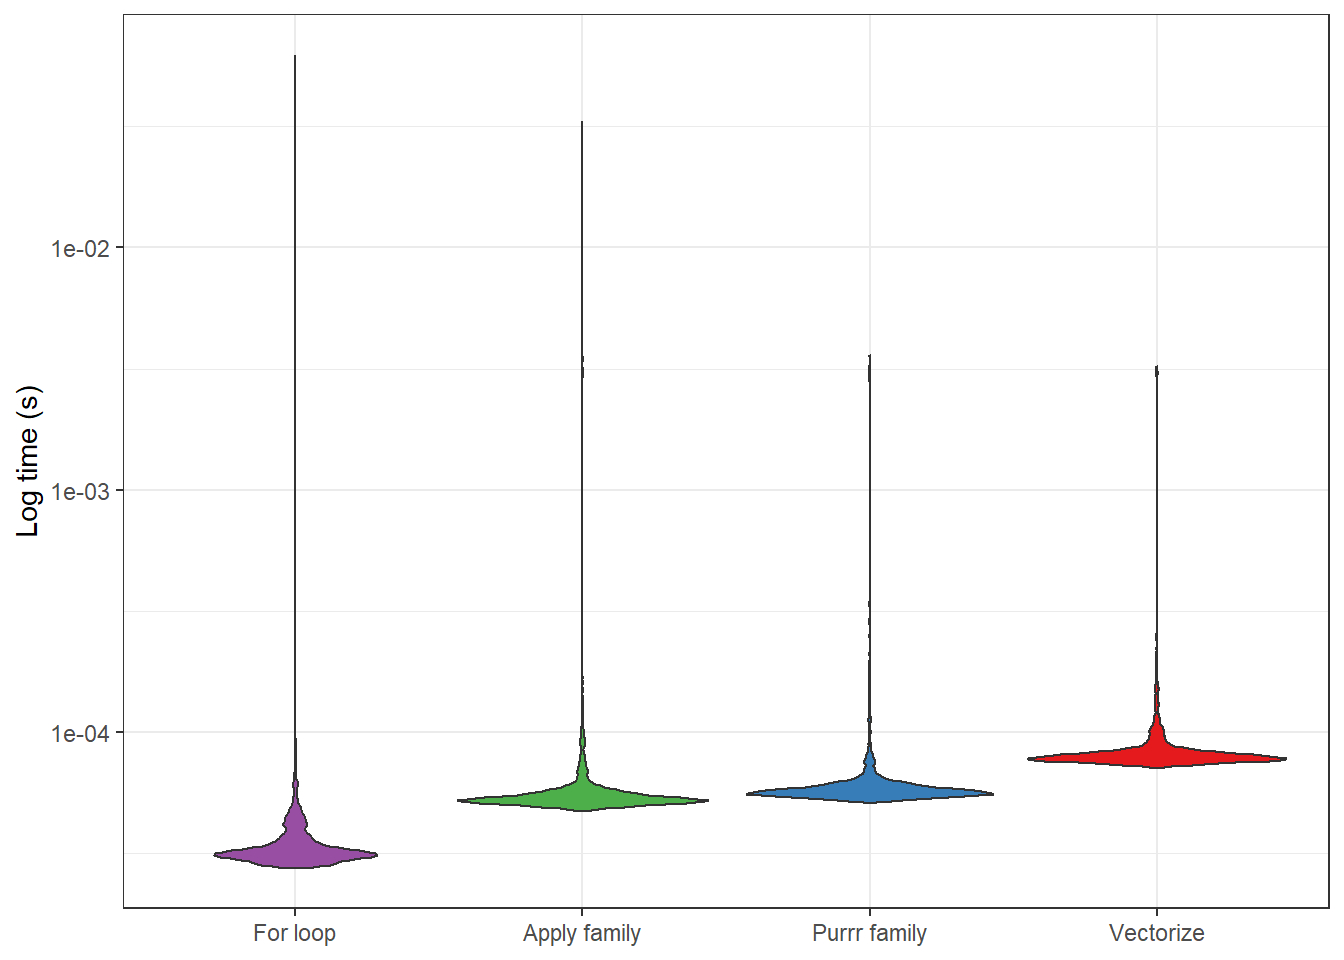
## 4 Vectorize 71.3us 79.6us 11917. 720BFascinating! It looks like the for loop function was fastest, while the vectorize function was slowest. Relatively, the for loop function was ~ 2 times faster than the vectorize function, on average (median).
But how do the results look? The image below provides some indication. It looks like the distributions of the processing times are pretty scattered (hence the need to log the scale), but the medians appear fairly representative. This, then, suggests that it is really the for loop function we’d want to use, if performance became a big issue. Or, given my exploration of Rcpp, we might want to consider writing the function in C++. But we’d need to run the code a lot to justify the work required for these alternative strategies.
vector_compare %>%
  unnest(cols = c(time, gc)) %>%
  select(expression, time, median) %>%
  arrange(median) %>%
  mutate(expression = fct_inorder(expression)) %>%
  mutate(time = as.numeric(time)) %>%
  ggplot(aes(expression, time, fill = expression)) +
  geom_violin(show.legend = FALSE) +
  labs(x = NULL,
    y = "Log time (s)") +
  scale_y_log10() +
  theme_bw() +
  scale_fill_brewer(palette = "Set1", direction = -1)
For more on Vectorize, check out this post by Dean Attali.
Bonus
Vectorize as a function factory
I mentioned earlier that Vectorize is taking advantage of R’s functional programming infrastructure. But how is it doing that? Well, that’s a bit beyond the scope of this post, but I do think it interesting to see what the internals of our new vectorized function look like:
equil_frac_vec## function (Ta, verbose = FALSE)
## {
## args <- lapply(as.list(match.call())[-1L], eval, parent.frame())
## names <- if (is.null(names(args)))
## character(length(args))
## else names(args)
## dovec <- names %in% vectorize.args
## do.call("mapply", c(FUN = FUN, args[dovec], MoreArgs = list(args[!dovec]),
## SIMPLIFY = SIMPLIFY, USE.NAMES = USE.NAMES))
## }
## <environment: 0x0000000015b5d288>That looks nothing like my original code! So something really fascinating is going on to turn the unvectorized function into that crazy set of lines above. But I’ll leave the exploration of that process for another post.
Other ways of applying conditions in R
Since we’re talking about conditionals, I thought it worth mentioning two other useful ways for applying conditions to a vector or other object: base::switch and dplyr::case_when. These are great for “unnesting” complicated control flows, making code easier to read, understand, and write. Worth checking out.