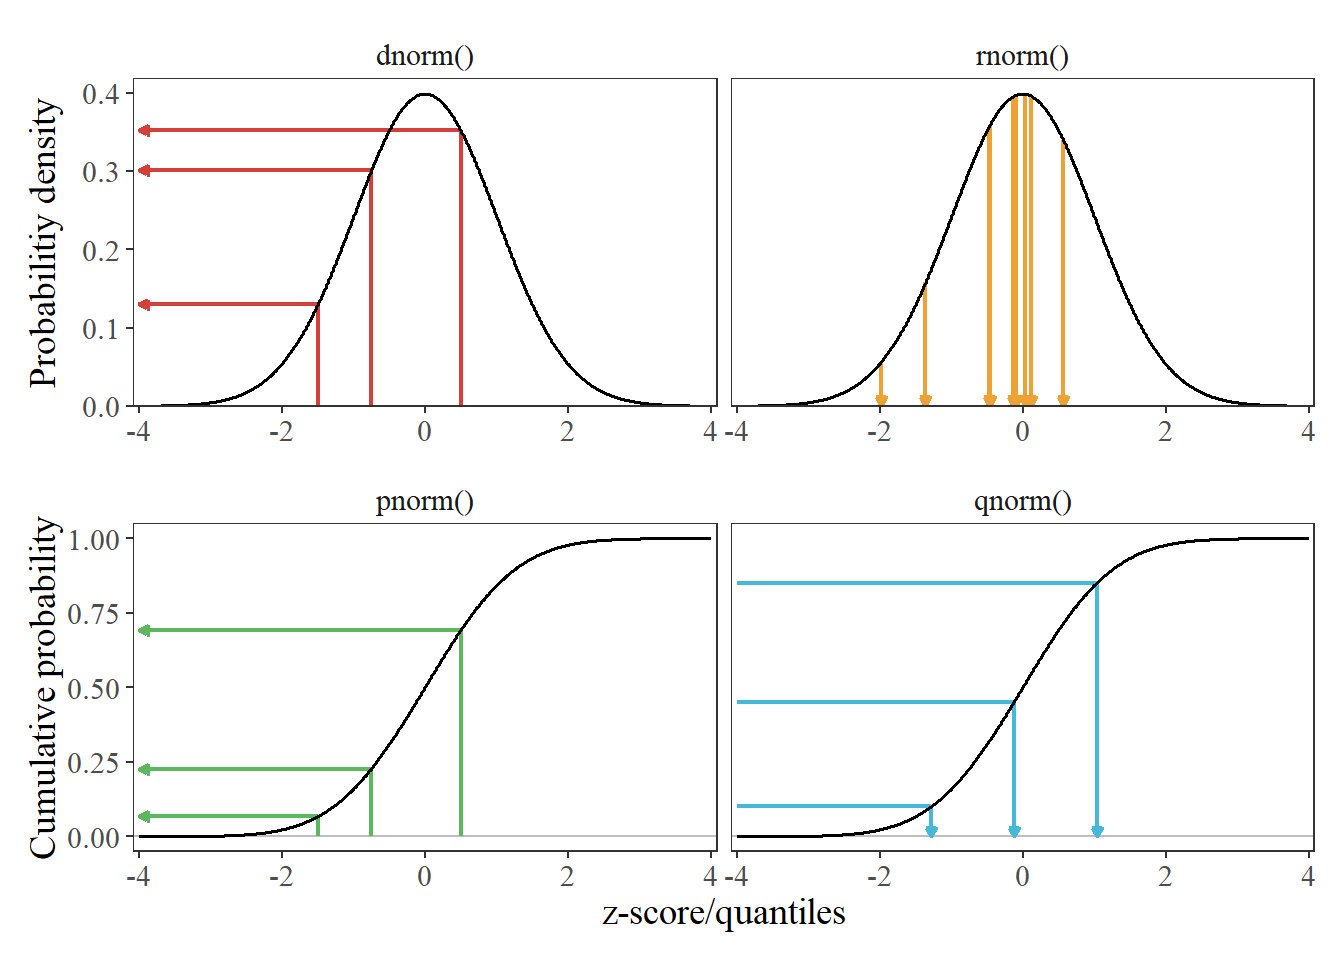
When I first started playing with the distribution functions in R I would always get confused as to what the different name combinations meant. For example, the differences between rnorm(), dnorm(), dt(), rbinom() were all pretty mysterious to me. Now I understand these names are composed of two parts:
Synopsis: Below are a number of examples comparing different ways to use base R, the tidyverse, and data.table. These examples are meant to provide something of a Rosetta Stone (an incomplete comparison of the dialects, but good enough to start the deciphering process) for comparing some common tasks in R using the different dialects. The examples start fairly simply and get progressively harder. I provide some additional information along the way, in case folks are new to R or programming more…
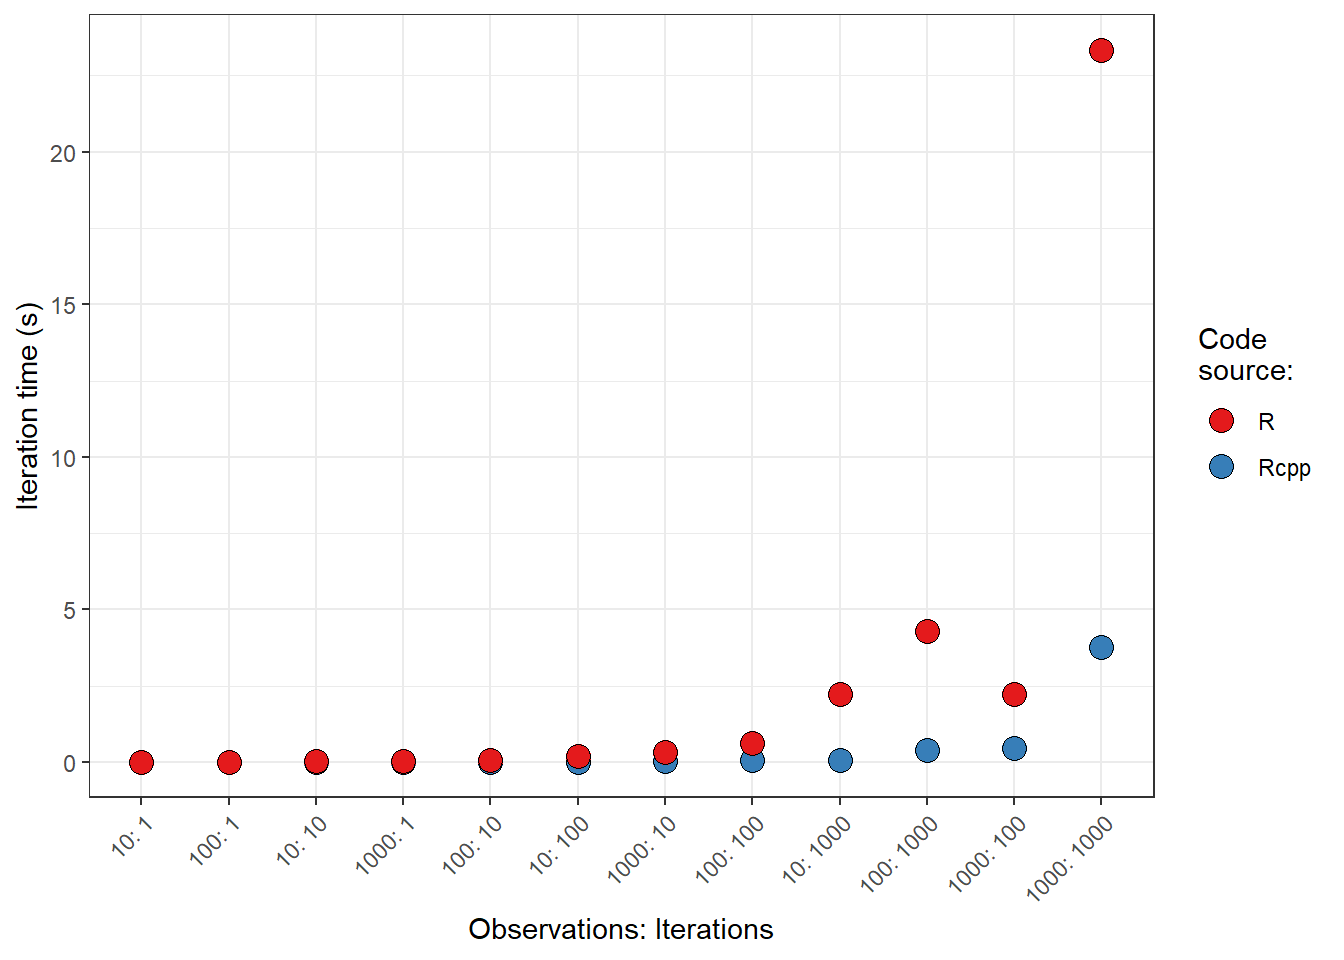
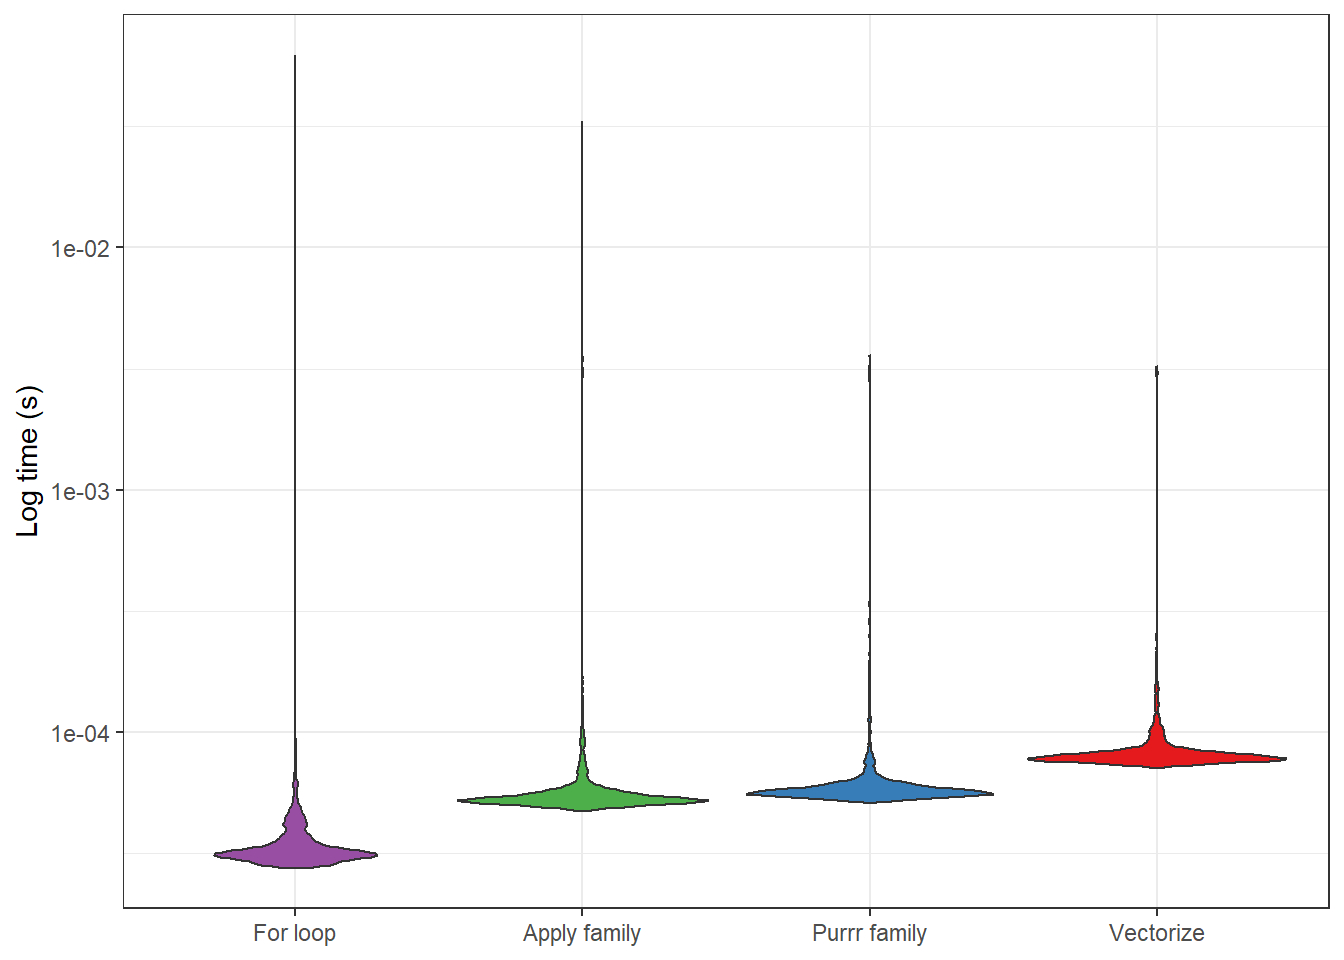
At the UW Data Science Center we’ve been talking speed lately. Generally R is considered a somewhat slow language (though I’m not sure that’s fair). However, there are some excellent packages and interfaces that can drastically speed up R. For example, the Rcpp package acts as an interface between R and C++, thereby allowing useRs to drastically speed-up analysis – or at least that’s the idea.